
CASE STUDY · SOLERA | OMNITRACS

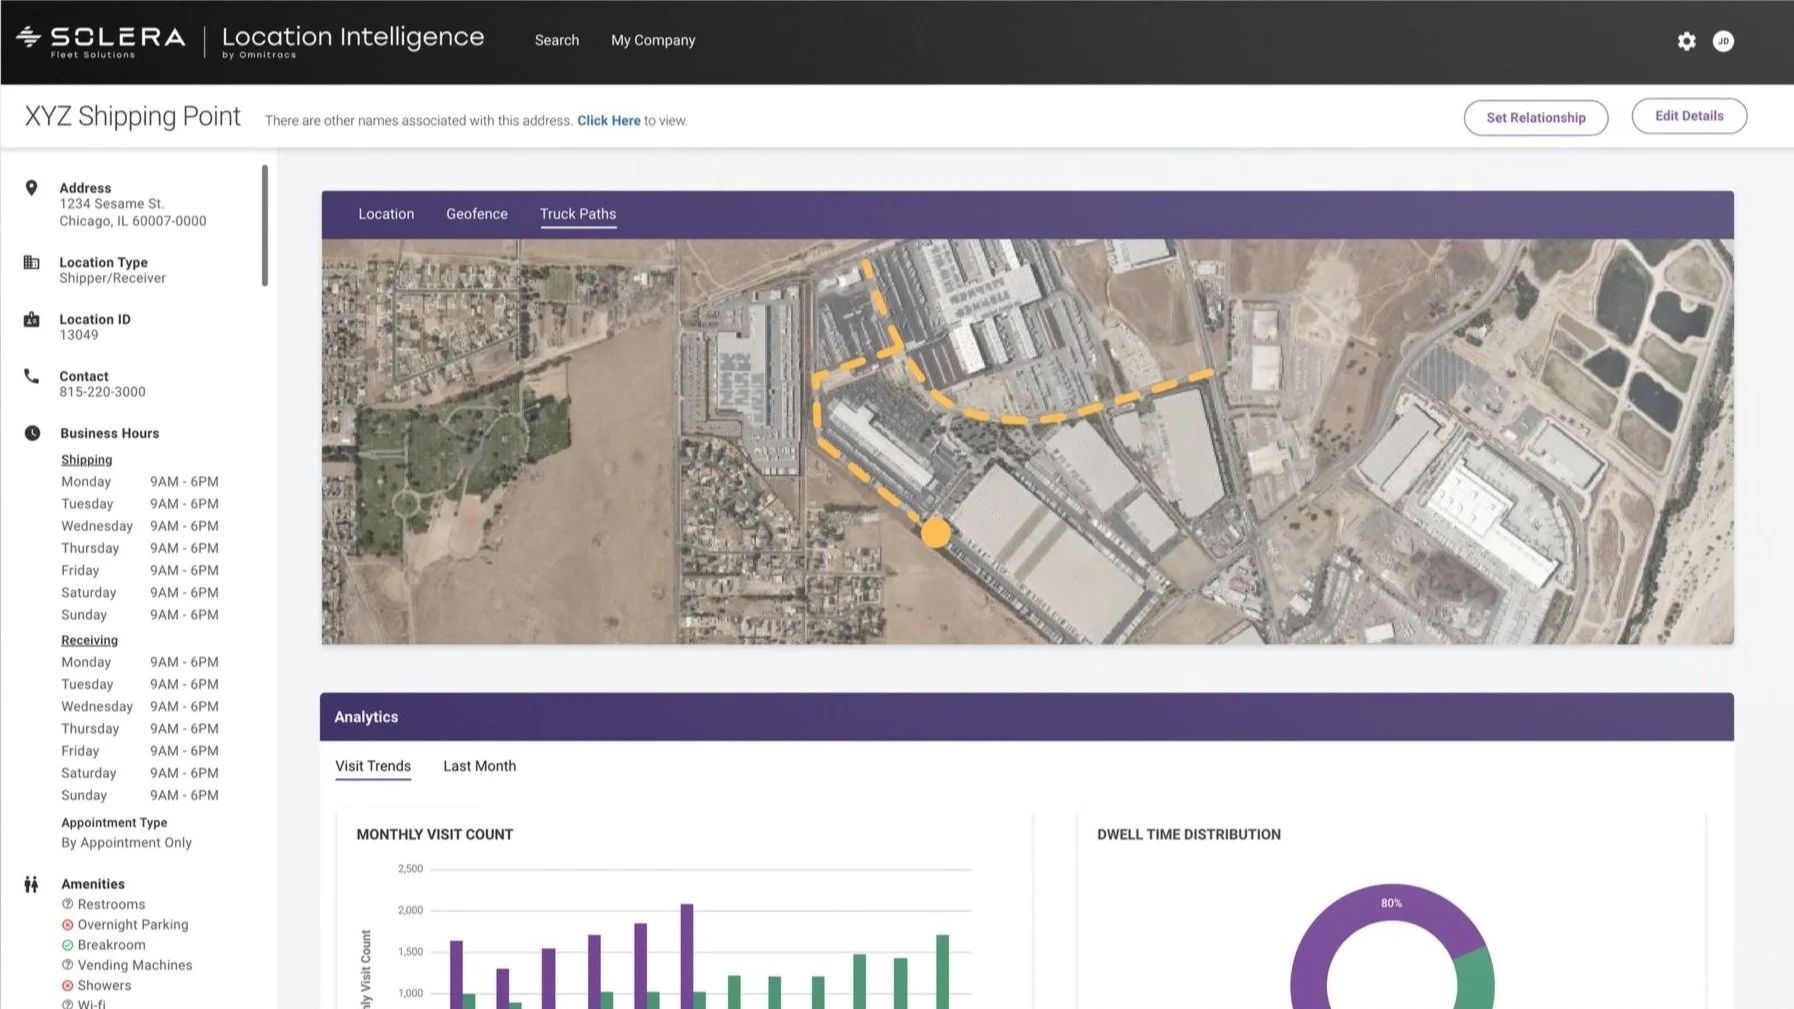
Solera Location Intelligence

Designing the “Yelp of Logistics” for 6M+ shipping and receiving facilities.

Role
Lead UX/UI Designer
Team
PM, Engineers, Data Architects
Timeline
14 months
Platform
SaaS web + mobile
Tools
Adobe XD, Jira
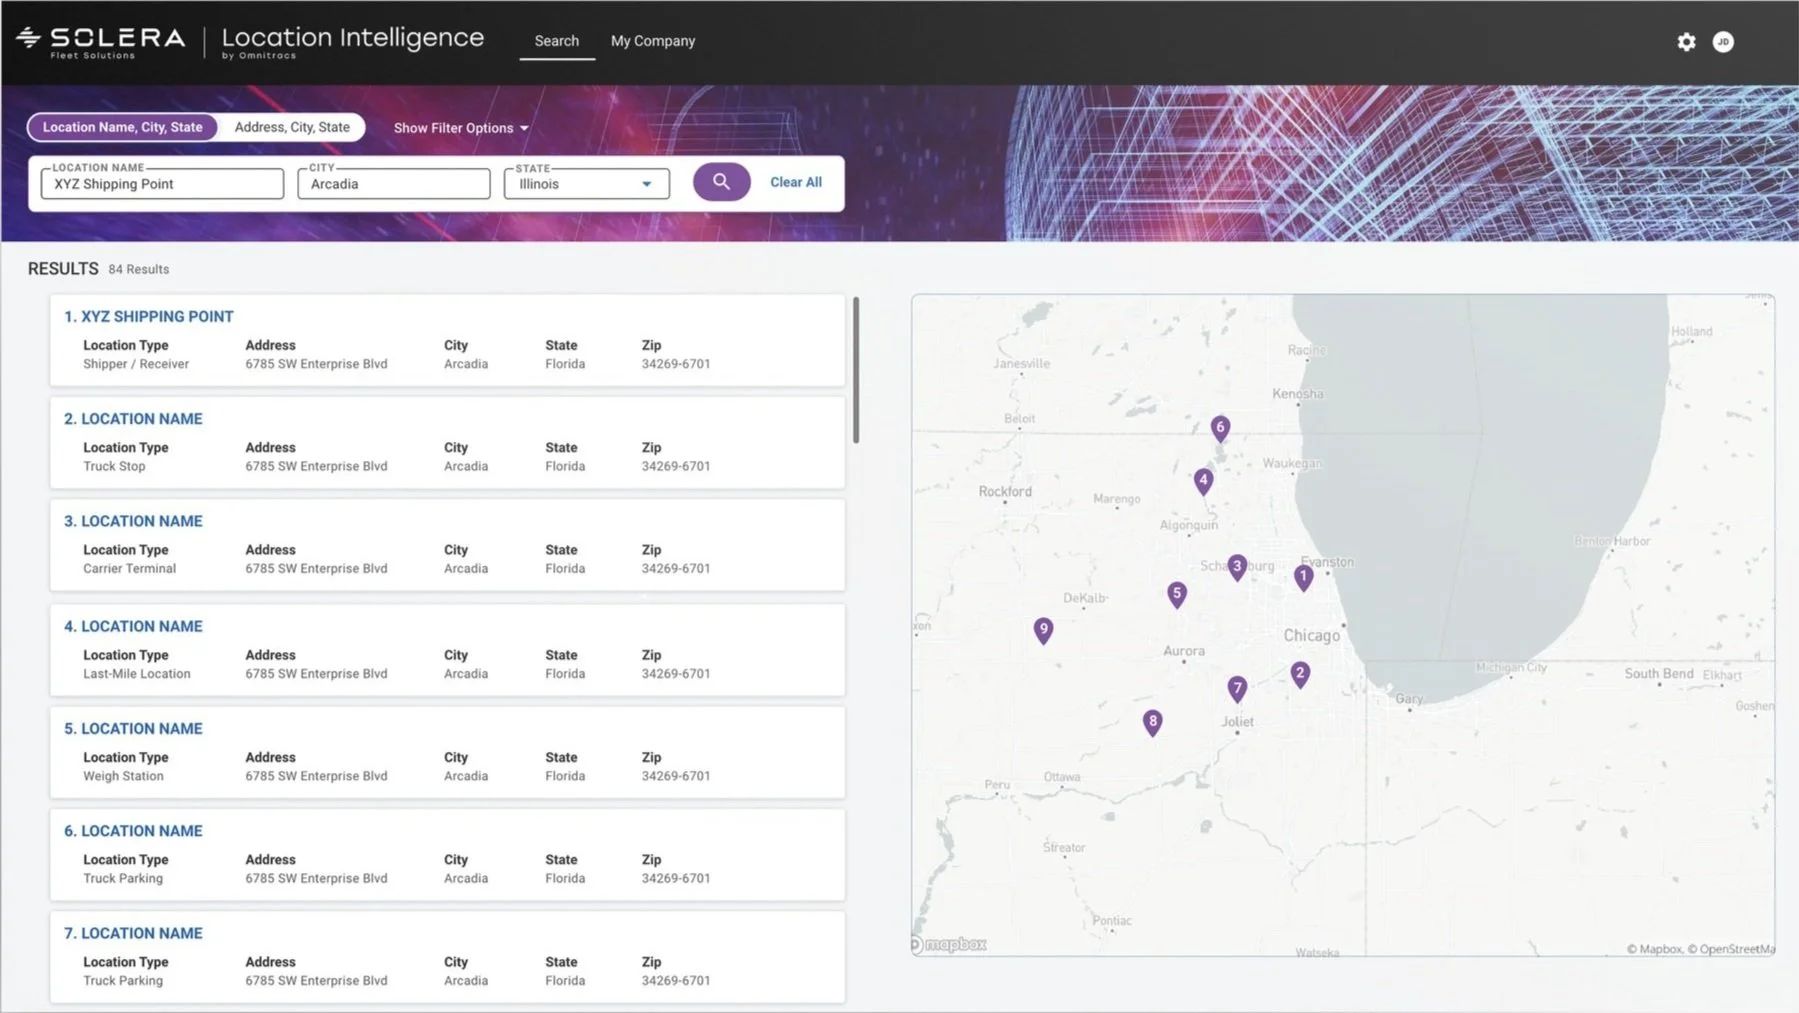
Solera Location Intelligence key screen

The challenge

Drivers lose nearly 30% of their paid time to detention at facilities, and no one had reliable data on wait times, parking or amenities. Shippers, carriers and drivers were all planning blind.

Project outcomes

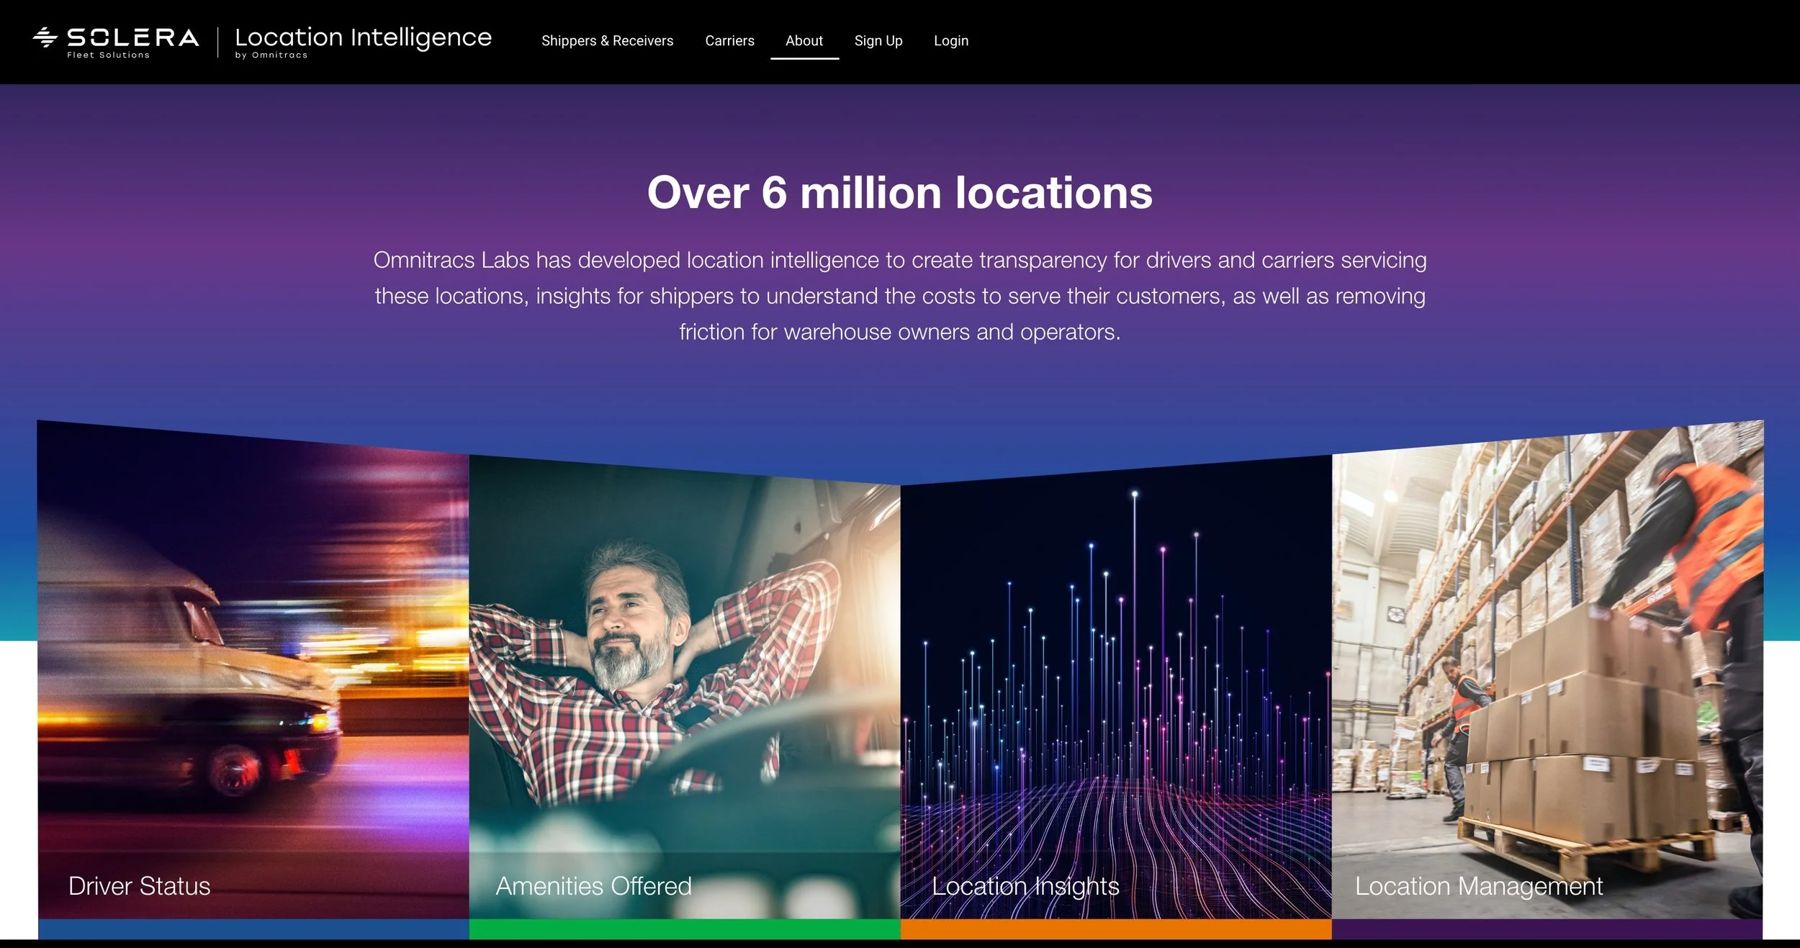
  • Shipped a 0→1 MVP unifying facility data for 6M+ locations
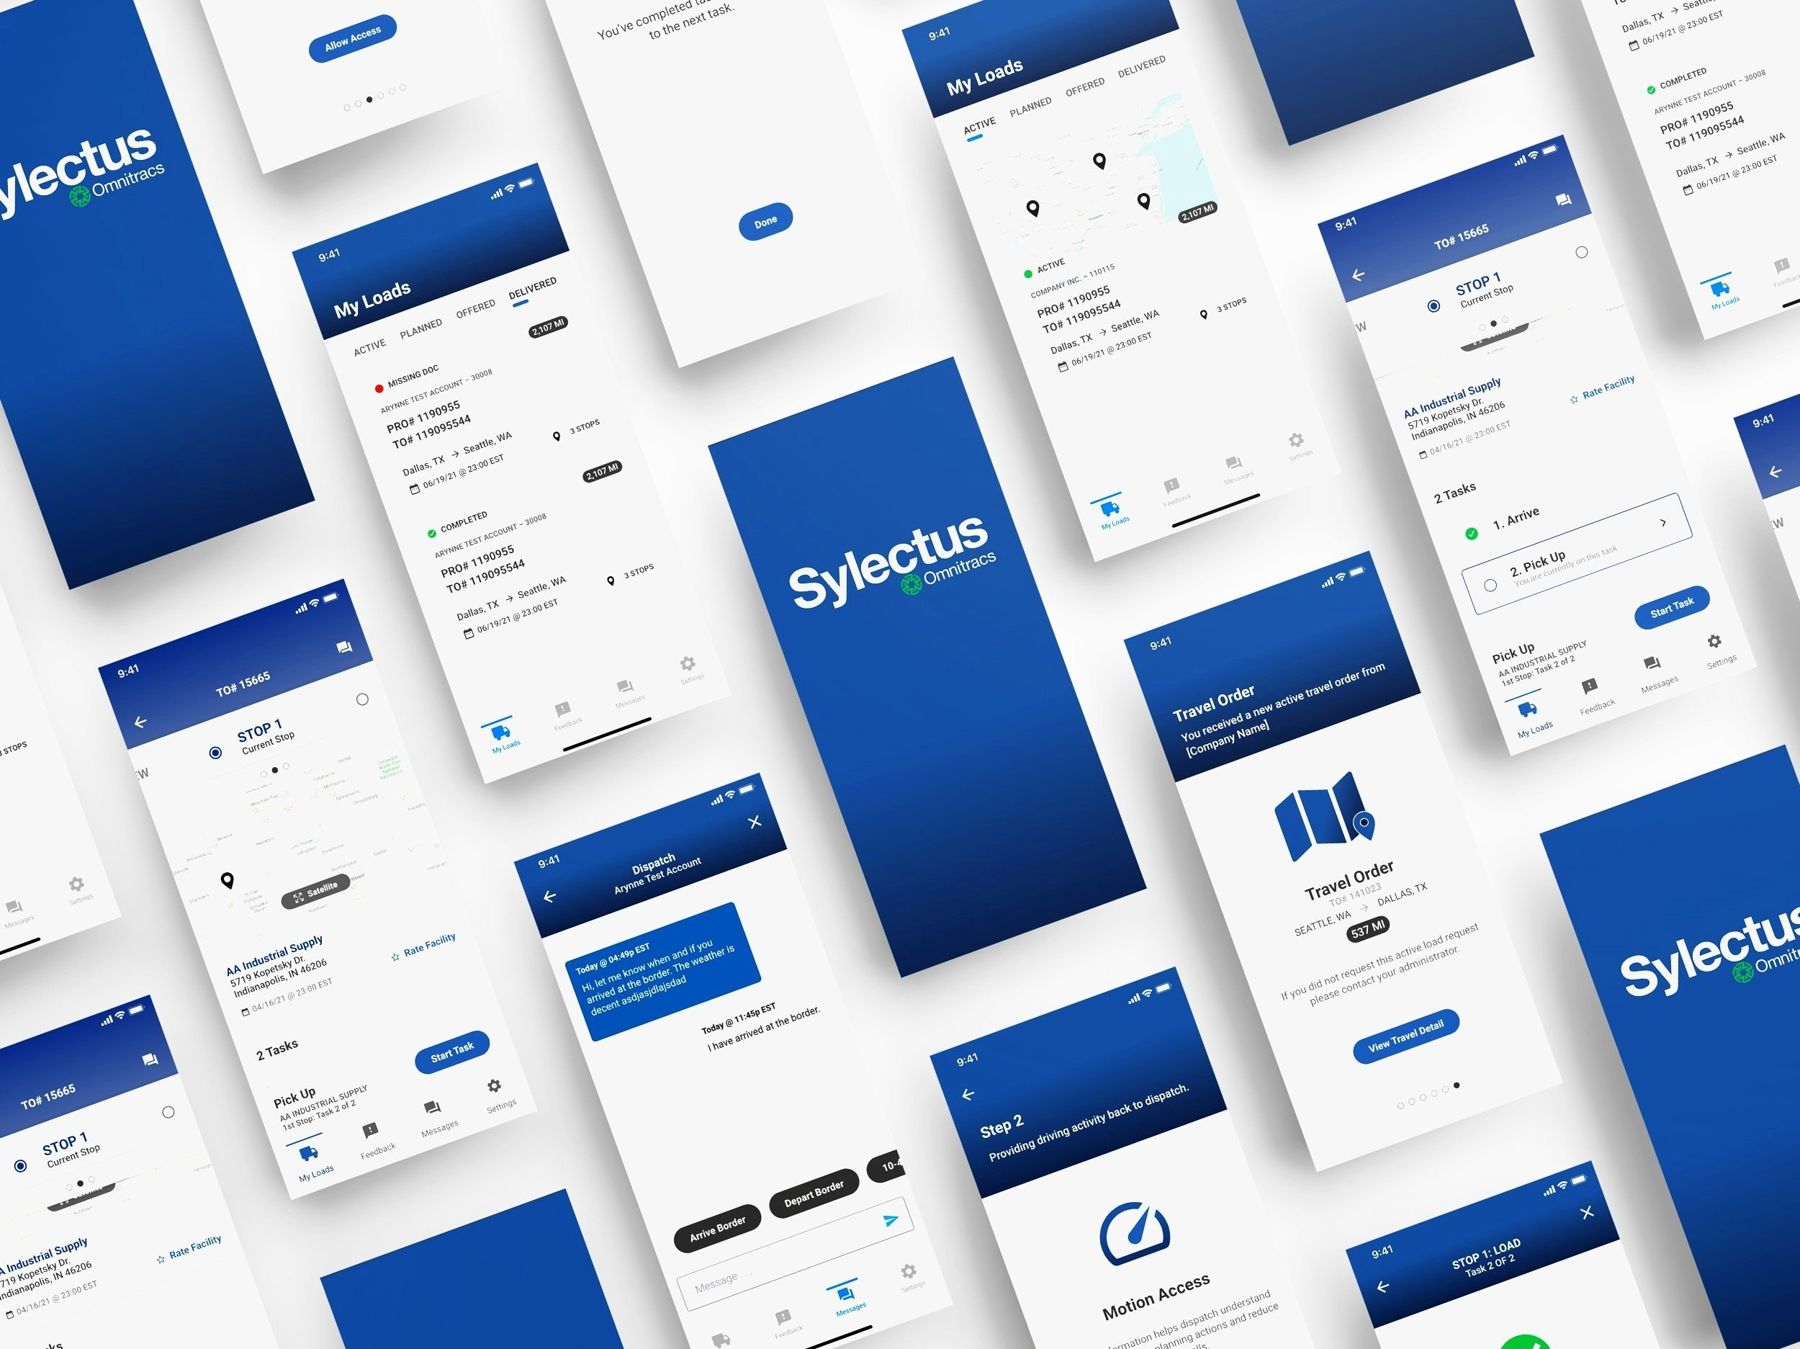
  • Connected the Sylectus Driver App to crowdsource real-time field data
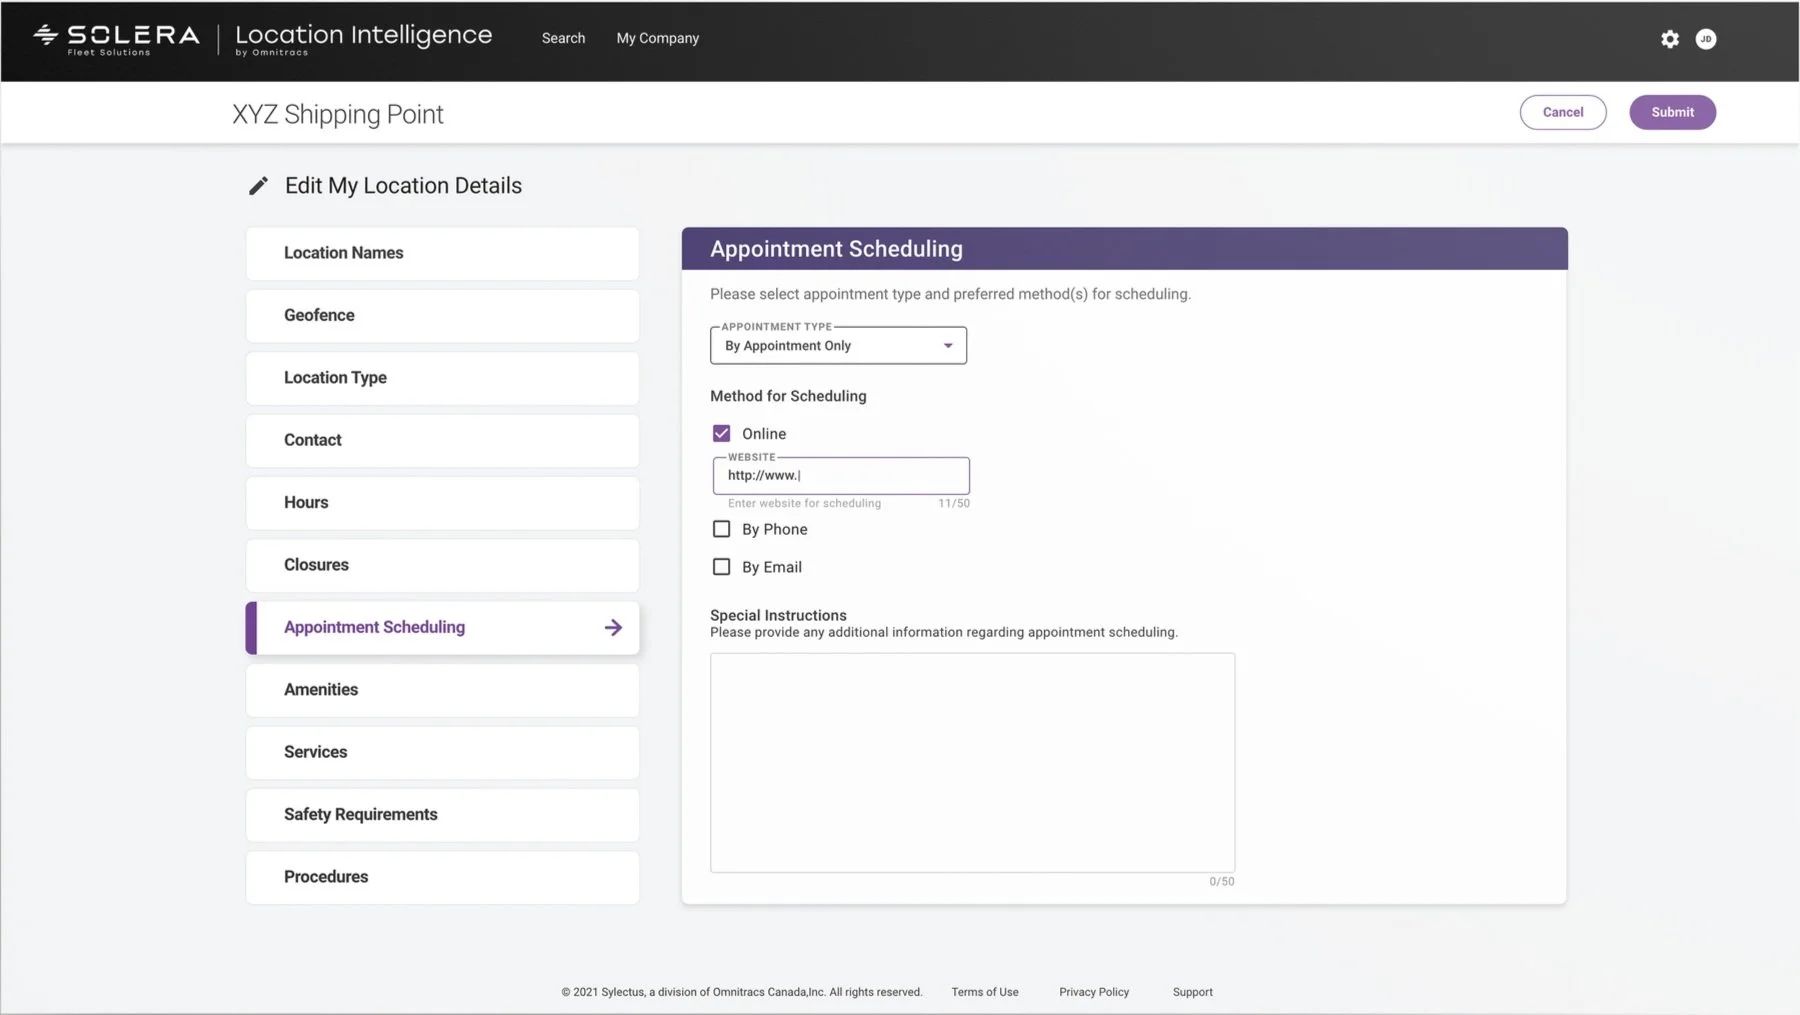
  • Scalable patterns for location search and geofence visualization

Role and responsibilities

What I owned

Research & Strategy

  • Identified cross-functional risks, dependencies and constraints to guide scope
  • Defined MVP requirements and advocated for a mobile-first strategy
  • Aligned enterprise goals with user needs into one roadmap

Design Execution

  • Turned complex logistics scenarios into journey maps, wireframes and workflows
  • Delivered hi-fi UI for the dashboard and Sylectus Driver App
  • Led a full UI overhaul to match Solera’s new brand

Systems & Launch

  • Mapped entity relationships (shippers, receivers, 3PLs) with data architects
  • Designed beta launch and app store marketing assets
  • Established patterns for location search and geofencing

Quantitative industry research

The hidden cost of waiting

DOT and OOIDA studies show drivers lose nearly 30% of paid time to detention. Trucks idle, earnings drop, and drivers rush to make up time.

20 hrsAverage weekly time lost per driver to facility delays
6.2%Higher accident risk for every 15 minutes of delay
$1BAnnual industry cost of detention and delays
11M tonsAnnual CO₂ emissions from idling trucks
“It’s a hit or miss there. Once it took an hour, and another time it took 4 hrs. My advice… just prepare for the worst case scenario.”
— Truck driver, from forum research

Solution overview

Two layers, one source of truth

Rather than choose between speed to market and long-term value, we paired a desktop platform for paying stakeholders with field data captured from drivers, creating a continuous feedback loop between on-the-ground conditions and facility intelligence.

Shippers & Receivers · DesktopCommunicate facility requirements and monitor performance.
Carriers & 3PLs · HybridPlan routes accurately and avoid unexpected delays.
Drivers · Mobile-firstNeed real-time facility conditions, and are the best source of that data.

Design decisions

How I drove it

KEY DECISION 01

Prioritized drivers, then sequenced the strategy

What I did. Research showed drivers carried the heaviest burden and generated the most reliable facility data. When stakeholders prioritized a desktop MVP for paying customers, I shaped a two-layer model: desktop for shippers and 3PLs, fueled by driver data from the Sylectus Driver App.

Why it mattered. It met commercial timelines without giving up the long-term value of real-world field data.
KEY DECISION 02

Designed through two rebrands

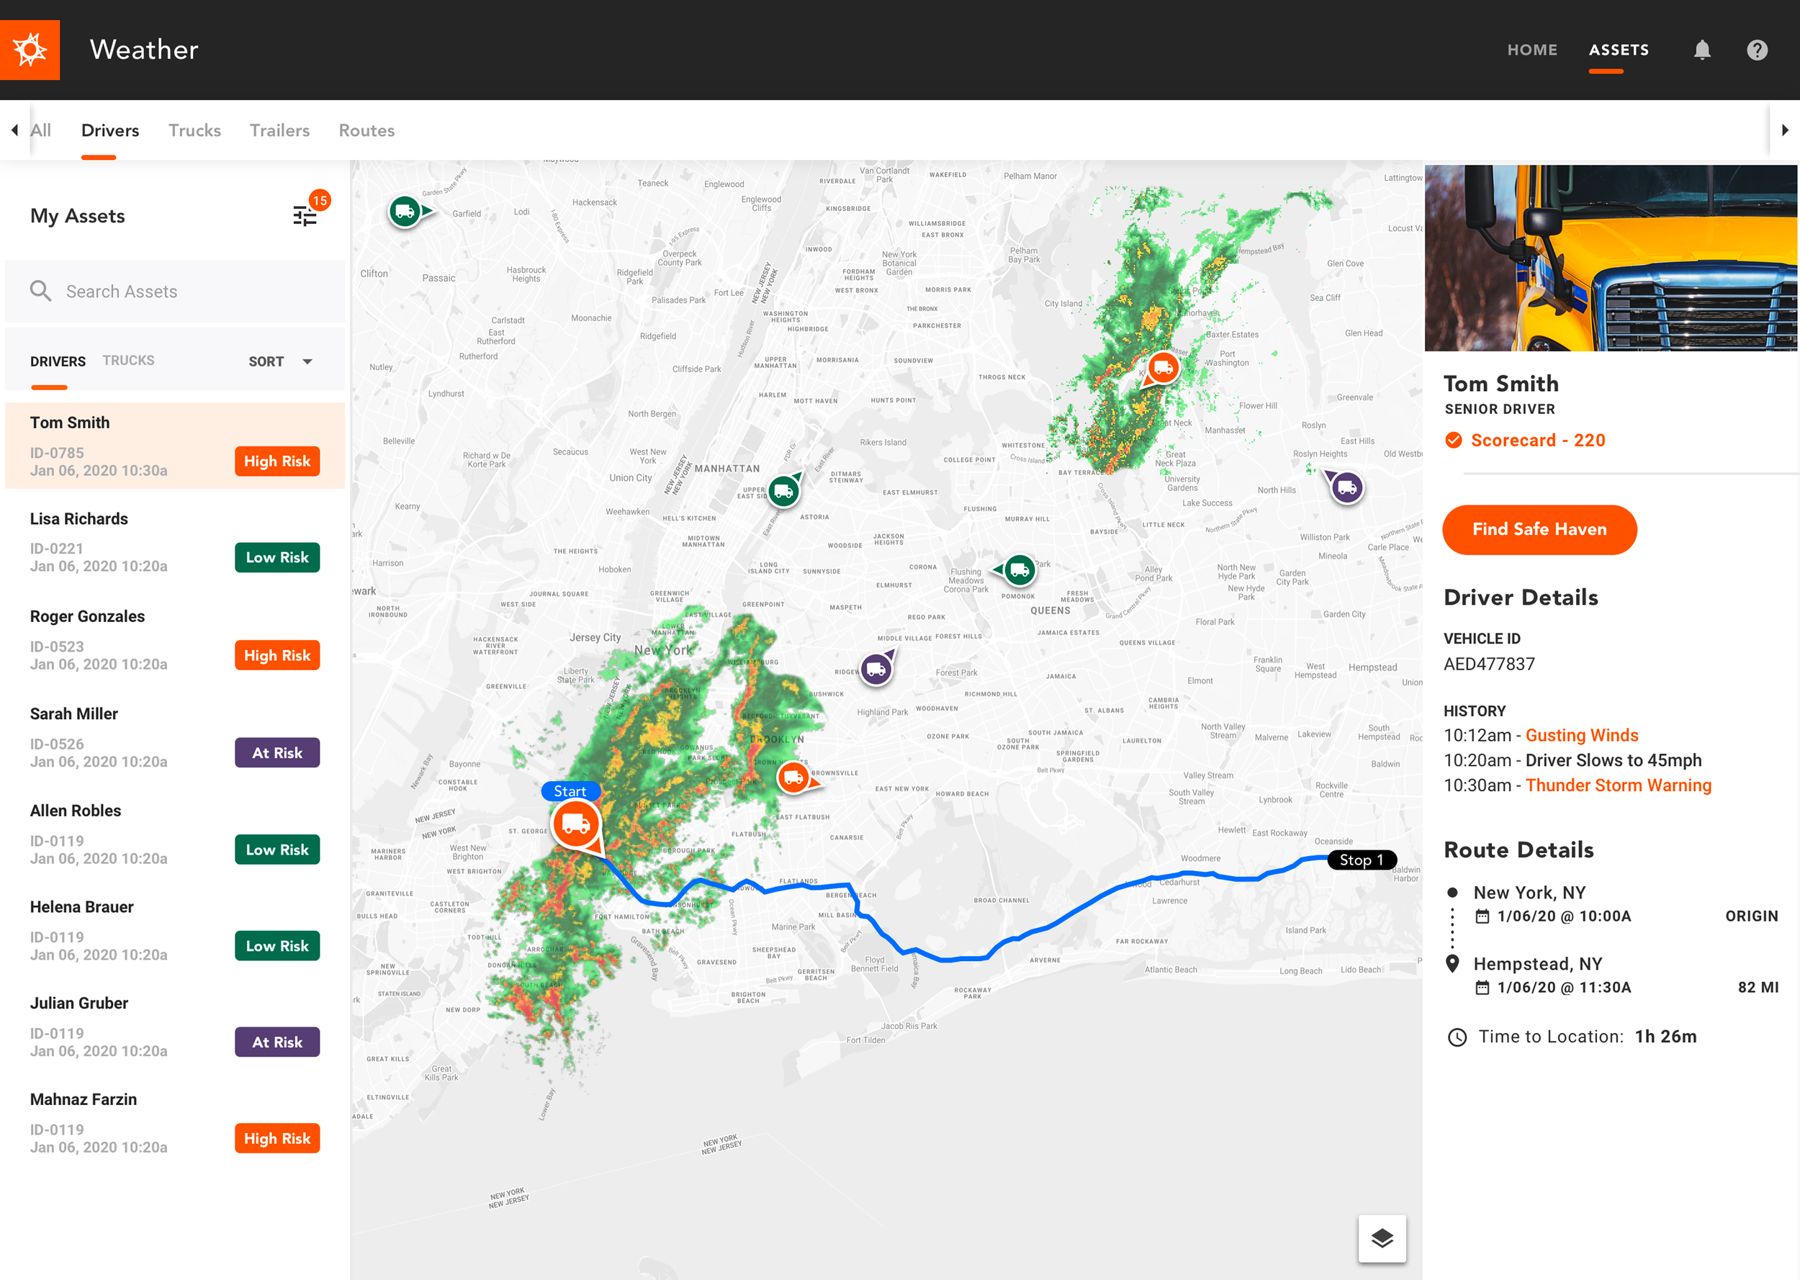
What I did. An acquisition triggered a full Solera rebrand, then a second brand strategy soon after. I restructured the MVP twice, anchoring on stable layouts, navigation and hierarchy rather than visual styling.

Why it mattered. The shifting brand forced clearer component reuse and left a cleaner, more scalable interface.

KEY DECISION 03

Prototyped to keep momentum

What I did. Built targeted prototypes, like the Edit Relationship flow, to validate terminology, test operational scenarios and align stakeholders before development.

Why it mattered. Early prototypes surfaced edge cases and gave the team a blueprint while the design system shifted around it.

Reflection

Reflection

Drivers experienced the friction, but the root cause sat upstream, at facilities where operational information wasn’t captured or shared. Connecting mobile driver signals with desktop facility intelligence created a shared source of truth across 6M+ locations.

Drivers surface the problem, facilities hold the root causeThe underlying issue was a lack of shared facility intelligence across the ecosystem.
Sequencing strategy mattersA desktop MVP drove adoption while mobile data capture built long-term intelligence.
Real intelligence requires systems thinkingReliable analytics means aligning contributors, incentives and data quality.